The Lucky Strike: One Breakout that Delivered Six Winning Trading Setups in a Row
When bulls manage to push price over a resistance, we never know whether it’s just a temporary “overshot” or a sustainable breakout. This is why that push over a resistance is not a trading signal by itself. In that article I will explain how you can detect a breakout and then confirm it with the Cycle Trader Indicator for TradingView.

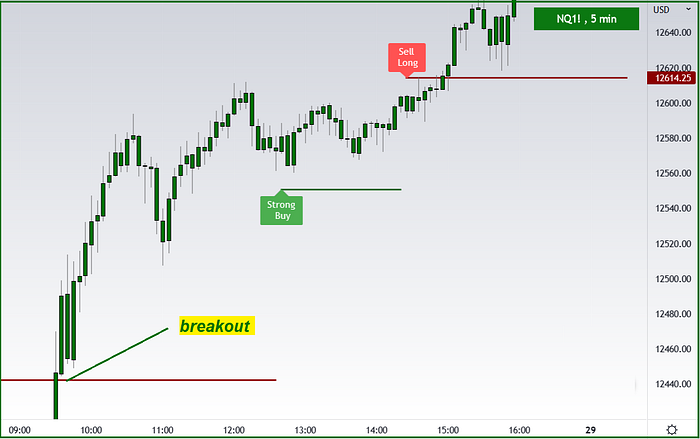
Both ES-mini and NQ-mini futures started the morning trading session on Friday, 27 May 2022 with a strong breakout over their respective cyclical resistance levels:

The chart of NQ-mini futures looked identical:

When bulls manage to push price over a cyclical resistance, we never know whether it's just a temporary “overshot” or a sustainable breakout. This is why that push over a resistance is not a trading signal by itself. Before I bet my money on a breakout scenario, I need to get confirmation that bulls will be able to keep pushing price much higher and not let bears to push price back under the broken resistance.
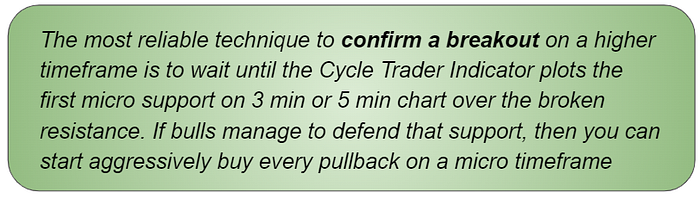
The most reliable technique to confirm a breakout on a higher timeframe is to wait until the Cycle Trader Indicator plots the first micro support on 3 min or 5 min chart over the broken resistance. If bulls manage to defend that support, then you can start aggressively buy every pullback on a micro timeframe:

On the micro 5 min chart of ES-mini shown above you can see that price broke over the cyclical resistance around 9–30 AM EST. When that happens, I recommend you not to chase the price but patiently wait for a tradeable pullback to go long. When the Cycle Trader indicator detects a long setup, it will print “Strong Buy” signal and send you an instant alert as a pop-up message to your screen and an email. In that case we had to patiently wait for four hours until that signal was printed at 1–45 PM EST. Note that signal delivered a quick and easy 25-point gain.
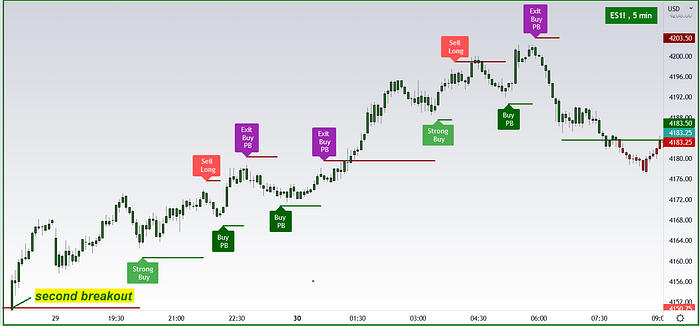
The Cycle Trader Indicator detected an attractive long setup at 12–40 PM EST:
Note that both ES-mini and NQ-mini did not even stop at new cyclical resistance levels accompanied by “Exit Long” signals.
The first completed topping sequence of signals the “Strong Buy” followed by the “Exit Long” confirms start of a new trending move up when is in up trending mode on a higher timeframe!
The breakout over a cyclical resistance on 60 min timeframe got confirmed around noon time and was followed by a very strong rally:
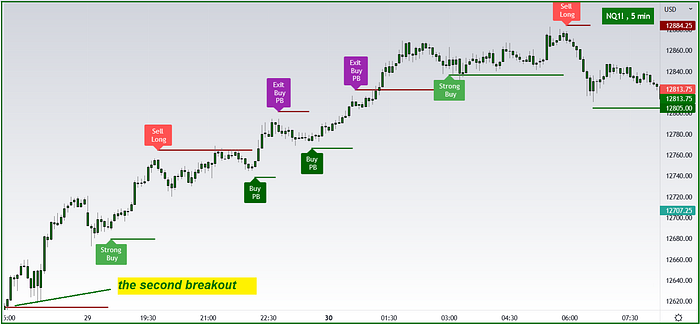
Just look at that lucky strike of four more long signals detected by the Cycle Trader indicator on NQ-mini micro chart during the short trading sessions on Sunday and Monday, 29–30 May 2022. Please note that bulls did not let bears to close any single 5 min candle under any of those green cyclical support levels!
The indicator detected five more winning long setups after bulls manage to break over resistance for the second time in one day on 27 May 2022.
The key takeaway:
One more important takeaway:
Read more about the Cycle Trader Indicator here.
Follow me on twitter: @MonkeyMakesSSS
Follow me on Instagram: @MonkeyMakesSSS
Subscribe to the Monkey Cycle Trader Indicator for TradinView and join the members only chat room!
You are protected with 15-day money back guarantee! No questions asked!
Important Disclaimer
Neither the author nor the publisher of this article is registered as an investment adviser nor a broker/dealer with either the U. S. Securities & Exchange Commission or any state securities regulatory authority. Readers of this article are advised that all information presented here is solely for informational purposes, is not intended to be used as a personalized investment recommendation, and is not attuned to any specific portfolio or to any user’s particular investment needs or objectives.
Trading stocks, options, or futures carries a high level of risk, and may not be suitable for all investors. Before deciding to trade, you should carefully consider your objectives, financial situation, needs and level of experience. The author provides general overview of trading methods that does not take into account your objectives, financial situation or needs. The content of this article must not be construed as personal advice.
Past results are not indicative of future profits.