Secrets of a Winning Reversal Setup
The vast majority of newbie traders loves to trade reversals. Reversals offer quick gain boosting your self-esteem and raising your self-confidence because, as an old adage says, “Markets take the stairs up and the elevator down.”
The problem is that a primitive toolbox used by 99% of retail traders is not capable of catching tops and bottoms on a consistent basis. In that article you will learn how to use multi timeframe analysis to avoid many losing trades when you go long or go short too early.

The relative strength index (RSI) is the most popular indicator used by traders to spot reversal setups.
The RSI is a technical indicator that compares the magnitude of recent gains to recent losses in an asset’s price in order to determine if it is overbought or oversold.
The RSI ranges from 0 to 100, with values above 70 indicating that the asset is overbought and values below 30 indicating that it is oversold. If the RSI is overbought and starts to decline, traders read it as a sign that the stock price is about to reverse and move down. Similarly, if the RSI is oversold and starts to rise, this could be a sign that the stock price is about to reverse and start moving up.
Let’s study a 30 min chart of QQQ from September 2022 with RSI indicator drawn on the lower panel:

We can see that RSI produced a number of winning trading setups. In particular long setups 1 and 3 produced nice tradeble bullish bounces. But the long setup 2 was not a good one because that signal was followed by a very small and hard to trade bounce.
RSI produced a bunch of bad short signals. The short setups No.7, 8, 9 would most likely leave you with a loss.
Let’s look how the classic RSI indicator performed in August 2022:

In August 2022 accuracy of trading signals produced by RSI was even lower that in the previous example. In particular, the long setups №1, 2, 5 and short setups №9, 10, 11, 12 and 13 would hardly make a trader make any money and would most likely result in a loss.
We can conclude that there were too many bad trading signals to consider using overbought and oversold signals a viable trading strategy.
Why at one time price perfectly turns down after RSI hitting an overbought zone but may keep stubbornly climbing higher despite numerous overbought signals at other times?
The main problem is that “overbought” or “oversold” is a highly subjective idea. If you are a day trader, you may focus on a short term 5 min chart and your oscillator can show you overbought conditions.
But if you are a swing trader, your main timeframe could be 30 min chart and that same move up that drove RSI into an overbought area on 5 min chart would look like the beginning of a rally on a 30 min chart.
Moreover, big funds and investors focus on Daily and Weekly charts and do not pay any attention to 5 min charts at all! They keep accumulating stocks in large volumes driving price higher and keeping its RSI in overbought zone on 5 min chart.
Therefore, we can conclude that to increase probability of a trading setup of a short timeframe you really have to take into consideration RSI reading and direction on higher timeframes.
In order to whether long-term investors consider price “overbought” or “oversold” we need to watch RSI readings on higher timeframes:
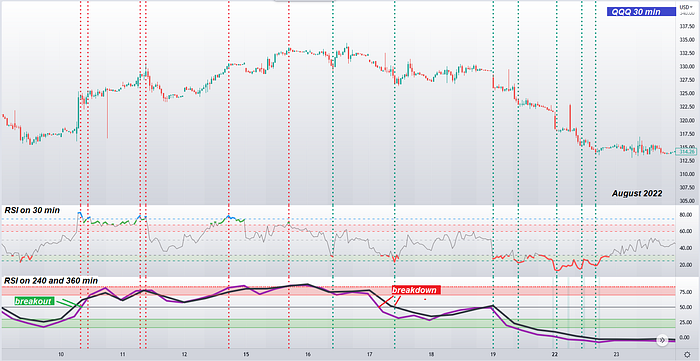
If you take longer term time frames into consideration, you will see that the short setup one was actually produce the very first move up that pushed longer term RSI over 50 level switching into up trending mode.
Conversely, when long term RSI drops under 50 level all the buy signals produced by the RSI on the base 30 min timeframe would not produce good bullish setups.
Takeaway №1:
You can consider an overbought condition of RSI on your base timeframe as a short setup only when RSI on a higher time frame is also in overbought condition!
You can consider an oversold condition of RSI on your base timeframe as a long setup only when RSI on a lower time frame is also in oversold condition!
Look how I applied that principle when I coded overbought and oversold signals generated by MTF Cycle Trader Indicator for @TradingView:
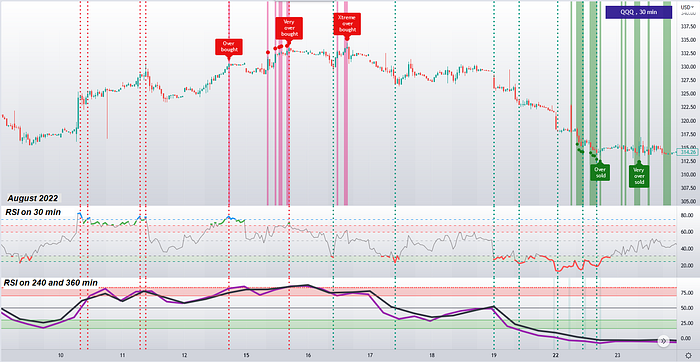
The indicator avoided generating many false short and long signals because it tracked not only one basic timeframe, but also waited for overbought and oversold signs on much higher timeframes.
I ended up adding three levels of price getting overbought or oversold:
(i) Overbought / Oversold, and
(ii) Very Overbought / Very Oversold, and
(iii) Extreme Overbought / Extreme Oversold.
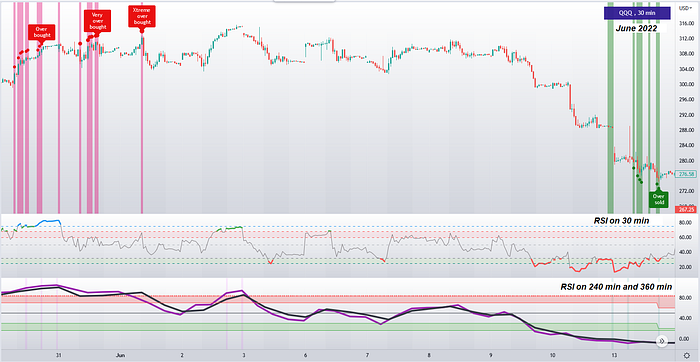
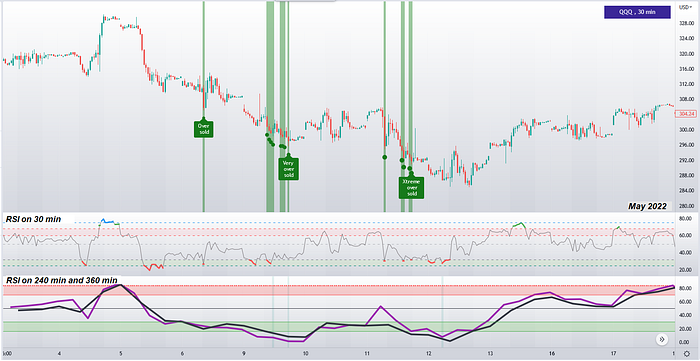
Very often long-term investors keep pushing price higher despite clear overbought conditions:
In general, you may expect a stronger drop from “Very Overbought” signal in comparison to a weaker ordinary “Overbought” signal. Similarly, you may expect a stronger reversal and a rally from “Very Oversold” signal in comparison to a weaker ordinary “Oversold” signal.
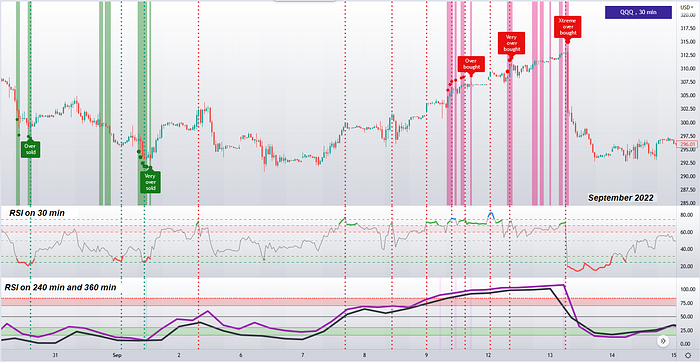
But the best shorting opportunities are produced by the Extreme Overboght signals”. Note that sharp drop in September after one of those signals.
Look at a seep pullback that followed the “Extreme Overbought” signal in July 2022:
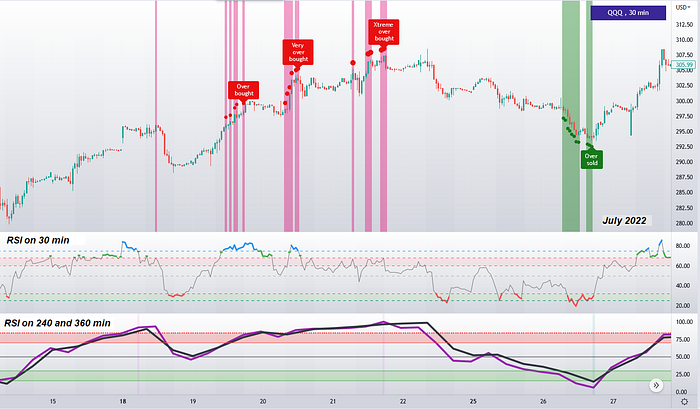
Please be aware that prolonged rallies that push price op to the limit and beyond quite often demoralize bulls to the extent that they feel scared to open shorts even days after bulls stopped buying:
The “Extreme Overbought” signal almost nailed the top of a big rally, but bears hesitated almost a week to start a new move down!
Note that every new move down into oversold territory was followed by a bigger corrective reaction:
Let me share you with you another important rule of successful reversal trading:
The market enters an overbought stage when it is trending up. The market is trending up when the majority of traders and investors alike expects price to move even higher. Therefore, when you short the market in overbought stage you essentially fight the majority of the market participants. To win in that trade you’ve got to cover your short quick on the first pullback because there will be a long list of other traders desperately waiting for a pullback to go long in anticipation of extension of that rally to new highs.
The market enters an oversold stage when it is trending down. The market is trending down when the majority of traders and investors alike expects price to move even lower. Therefore, when you go long the market in oversold stage you essentially fight the majority of the market participants. To win in that trade you’ve got to sell your speculative long quick on the first pullback because there will be a long list of other traders desperately waiting for a pullback to go short in anticipation of extension of that decline to new lows.
In the next article I will share with you a model showing how cycles on different timeframes interact and form major tops and troughs and suggest one specific spot where a reversal trade may deliver a much bigger gain with a much lower risk.
To use my proprietary MTF Cycle Trader Indicator for @TradingView consider subscribing here.
Read about much more powerful trading indicators for TradingView:
- how the Cycle Trader Indicator identifies an underlying cycle and prints support, resistance and trading signals; and
- how the Multi timeframe version of the Cycle Trader indicator identifies cycles on four different timeframes and finds points where all four cycles make important tops and bottoms; and
- watch a video showing how the Gann’s Levels indicator provides you with price and time targets and levels of important support and resistance weeks in advance;
- watch a video where I explain how you can convert levels of support and resistance drawn by the Cycle Trader indicator into winning trading setups.
- Follow me on twitter: @MonkeyMakesSSS
- Subscribe to the Monkey Cycle Trader Indicator for TradinView and join the members only chat room!
- You are protected with 15-day money back guarantee! Request a refund if you do not like our indicators. No questions asked!
Important Disclaimer
Neither the author nor the publisher of this article is registered as an investment adviser nor a broker/dealer with either the U. S. Securities & Exchange Commission or any state securities regulatory authority. Readers of this article are advised that all information presented here is solely for informational purposes, is not intended to be used as a personalized investment recommendation, and is not attuned to any specific portfolio or to any user’s particular investment needs or objectives.
Trading stocks, options, or futures carries a high level of risk, and may not be suitable for all investors. Before deciding to trade, you should carefully consider your objectives, financial situation, needs and level of experience. The author provides general overview of trading methods that does not take into account your objectives, financial situation or needs. The content of this article must not be construed as personal advice.
Past results are not indicative of future profits.