How to Confirm a Reversal from Overbought and Oversold Zones

In the previous article I explained why making trading decisions based on signals generated by an oscillator on one basic timeframe will not work well. In this article I will introduce you to a simple cycle model that can explain how the stock market forms important tops and bottoms. We will try to find a repeating pattern that confirms bullish and bearish reversals.
When you use any standard oscillator, you track only one underlying cycle. That oscillator would produce many good long and short signals (see the green and red arrows on teh chart below).

But sadly, it will produce an equal number of bad signals. Quite often price will continue climbing higher despite turn down of the oscillator. That happens because there are numerous independent cycles of different periods and wavelength behind any price move.
According to the cycle theory developed by J.M. Hurst, stock prices are driven by a combination of long-term, intermediate-term, and short-term cycles. Each of these cycles is characterized by a specific period and wavelength.
A key concept in the cycle theory developed by J.M. Hurst is the principle of proportionality.
According to the principle of proportionality, the relationship between the periods and wavelengths of different cycles is proportional, meaning that the longer the period of a cycle, the stronger its influence over stock price is.
Let’s see what kind of an elephant we missed in the room:

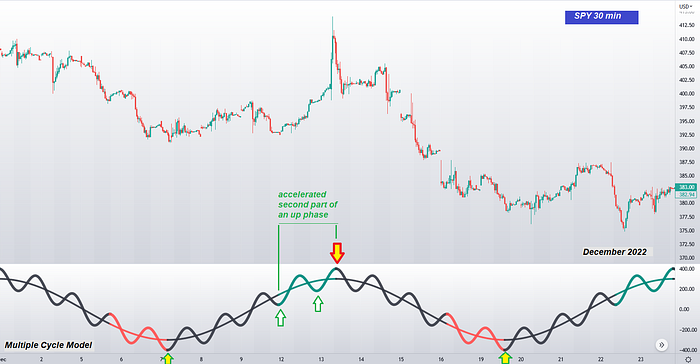
A trader who attempted to go long and short based on signals produced by a standard oscillator like RSI would completely miss a bigger picture. In particular, that standard oscillator applied to his base timeframe of 30 min would not be able to detect a bigger cycle that actually perfectly nailed two troughs and one peak.
That cycle model is a great example how the principle of proportionality works in real life. Note that when the longer cycle starts an accelerated move up approaching its top (the green section) the down phase of a small cycle is unable to produce any bearish pressure on price. Similarly, when the longer cycle starts an accelerated move down approaching its bottom (the red section), the up phase of a small cycle is unable to produce any bullish pressure on price.
As I explained in my first article on the cycle theory, the most useful discovery J.M.Hurst made was the Principle of Synchronicity. According to that principle, from time to time several distinctive cycles reach their respective bottoms simultaneously.
On the chart below you can see that the micro short-term cycle and longer-term cycle get aligned at important troughs and peaks.

Hurst argued that adding several cycles together we can explain movement of price. He called that the Principle of Summation.
On the chart below you can see how the Principle of Summation and Proportionality work together:

On this chart I plotted summation of two separate cycles shown on the previous char above. You can see that the short-term cycle can only push price up and down around the major move that is impacted by a much more powerful long-term cycle.
From this chart you can make a couple of very important conclusions that would let you build more accurate trading systems:
(1) a weaker short-term cycle plays an important role in the first half of an up phase of the longer-term cycle and the first half of a down phase of the longer-term cycle, and
(2) when a longer-term cycle enters the second accelerated part of an up phase, every turn up in a short-term cycle is followed by a strong move up to a higher high:
(3) when a longer-term cycle enters the second accelerated part of a down phase, every turn down in a short-term cycle is followed by a strong decline to lower lows:

Now you may jump to conclusion that this looks like another nice theory. Let me show you how those conclusions can help you to make better trading decisions. To perform multi timeframe analysis you do not need to buy any expensive software. You can perfectly use a free yet mighty TradingView platform. You just need to plot together your favorite oscillator calculated on your base timeframe and a much higher timeframe:
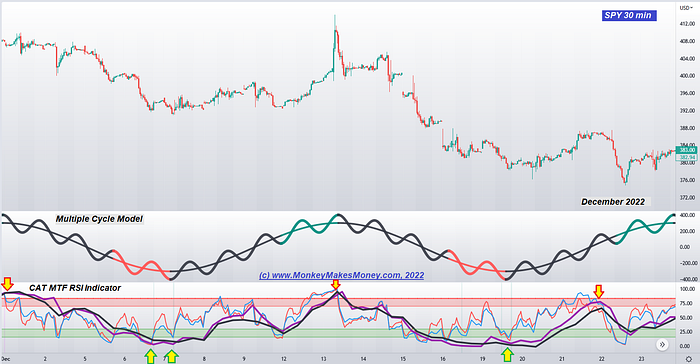
As you can see my CAT MTF RSI indicator for TradingView confirms that short-term and long-term cycles make important tops and troughs at the same time!
That chart supports a very important conclusion we made in the previous article:
You can consider an overbought condition of RSI on your base timeframe as a short setup only when RSI on a higher time frame is also in overbought condition!
You can consider an oversold condition of RSI on your base timeframe as a long setup only when RSI on a lower time frame is also in oversold condition!
But in that previous article I shared numerous case studies showing that a short setup based on overbought RSI is a risky setup. An overbought RSI is only a pre-requisite condition for short setup. To improve winning rate of a short reversal setup we need to get confirmation that the price has turned.
On the chart below you can see what can become a reliable confirmation that the market made a turn up after reaching oversold condition or turned down after reaching oversold condition:
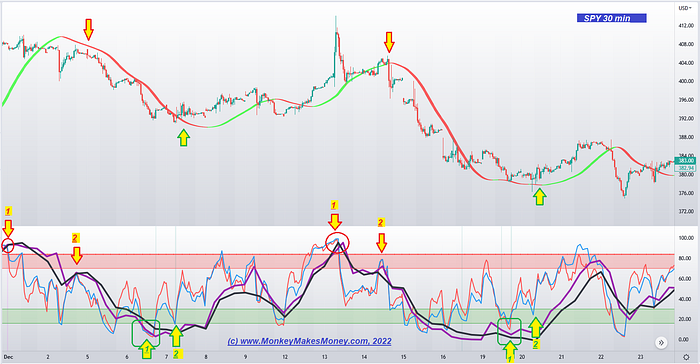
This is a two-step process to identify a top and subsequent turn down:
(i) The top is confirmed by price oscillators calculated on short-term and long-terms timeframes that get aligned in the overbought zone.
(ii) a subsequent turn down is confirmed by a weak up move in short-term RSI making a lower high.
This is a two-step process to identify a bottom and subsequent turn up:
(i) The bottom is confirmed by price oscillators calculated on short-term and long-terms timeframes that get aligned in the oversold zone.
(ii) a subsequent turn up is confirmed by a weak down move in short-term RSI making a higher low.
To use my proprietary CAT MTF RSI Indicator for @TradingView consider subscribing here.
Read about much more powerful trading indicators for TradingView:
- how the Cycle Trader Indicator identifies an underlying cycle and prints support, resistance and trading signals; and
- how the Multi timeframe version of the Cycle Trader indicator identifies cycles on four different timeframes and finds points where all four cycles make important tops and bottoms; and
- watch a video showing how the Gann’s Levels indicator provides you with price and time targets and levels of important support and resistance weeks in advance;
- watch a video where I explain how you can convert levels of support and resistance drawn by the Cycle Trader indicator into winning trading setups.
- Follow me on twitter: @MonkeyMakesSSS
- Subscribe to the Monkey Cycle Trader Indicator for TradinView and join the members only chat room!
- You are protected with 15-day money back guarantee! Request a refund if you do not like our indicators. No questions asked!
Important Disclaimer
Neither the author nor the publisher of this article is registered as an investment adviser nor a broker/dealer with either the U. S. Securities & Exchange Commission or any state securities regulatory authority. Readers of this article are advised that all information presented here is solely for informational purposes, is not intended to be used as a personalized investment recommendation, and is not attuned to any specific portfolio or to any user’s particular investment needs or objectives.
Trading stocks, options, or futures carries a high level of risk, and may not be suitable for all investors. Before deciding to trade, you should carefully consider your objectives, financial situation, needs and level of experience. The author provides general overview of trading methods that does not take into account your objectives, financial situation or needs. The content of this article must not be construed as personal advice.
Past results are not indicative of future profits.